IIT MADRAS
Business Data Management
Research Work
Optimizing Agricultural Market Operations Using Data
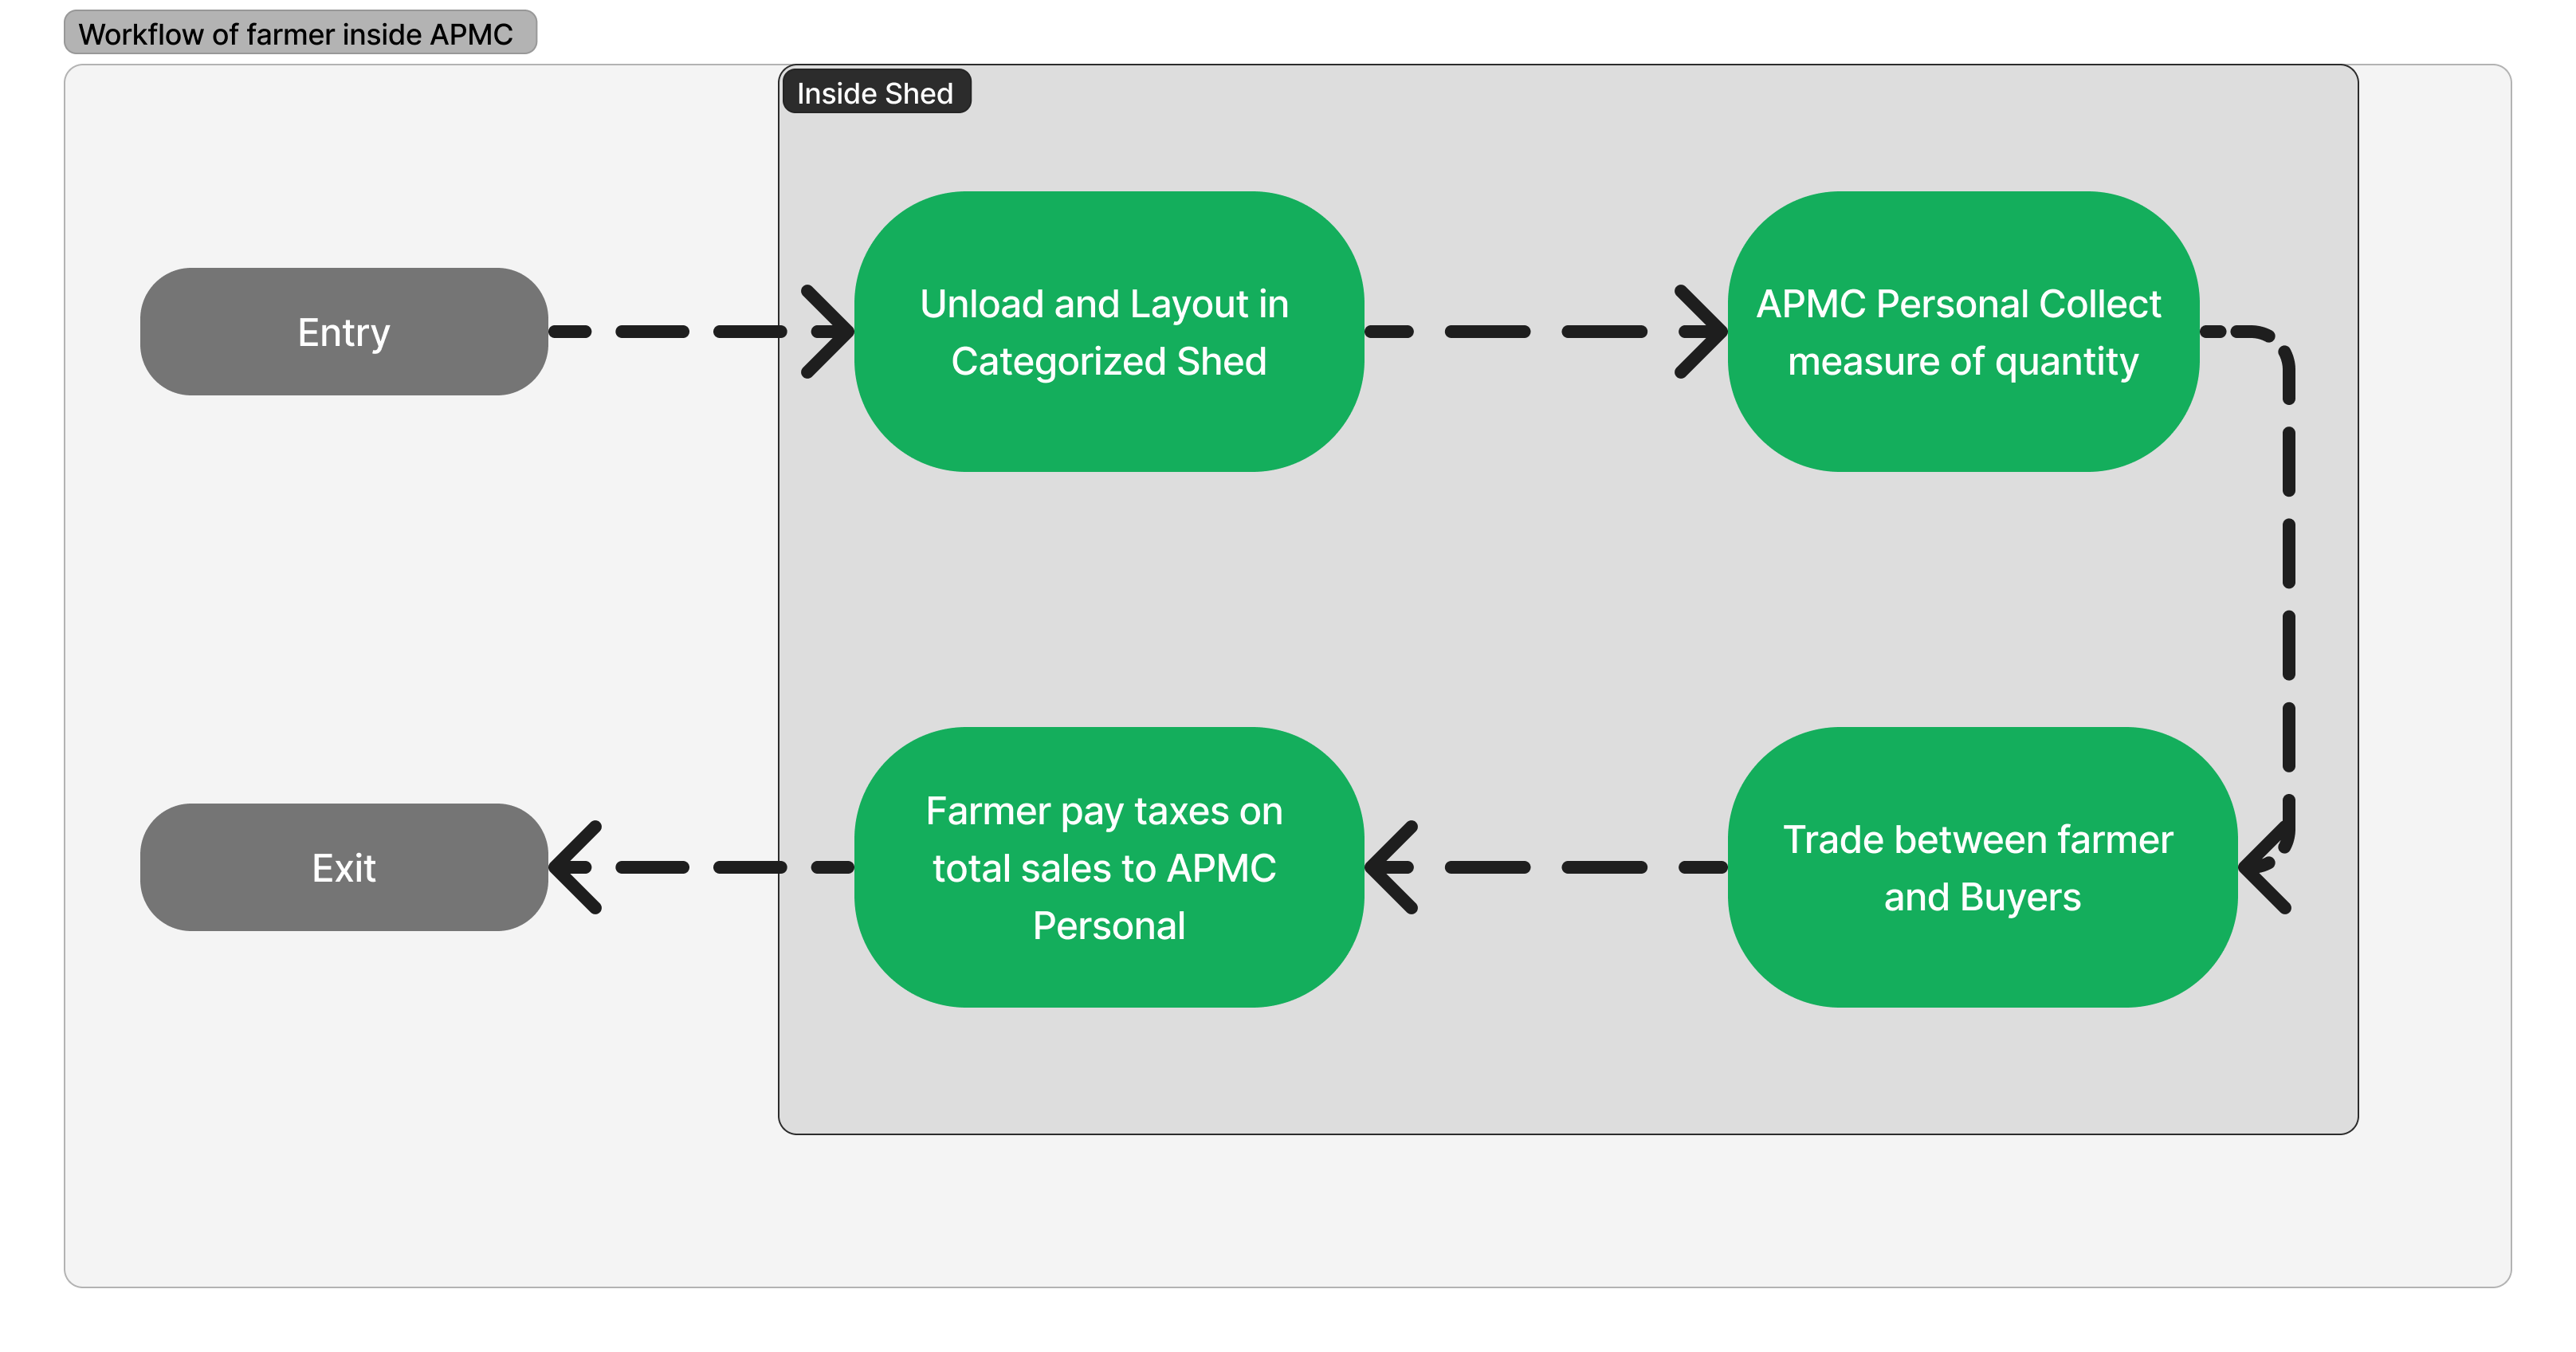
Farmer Workflow
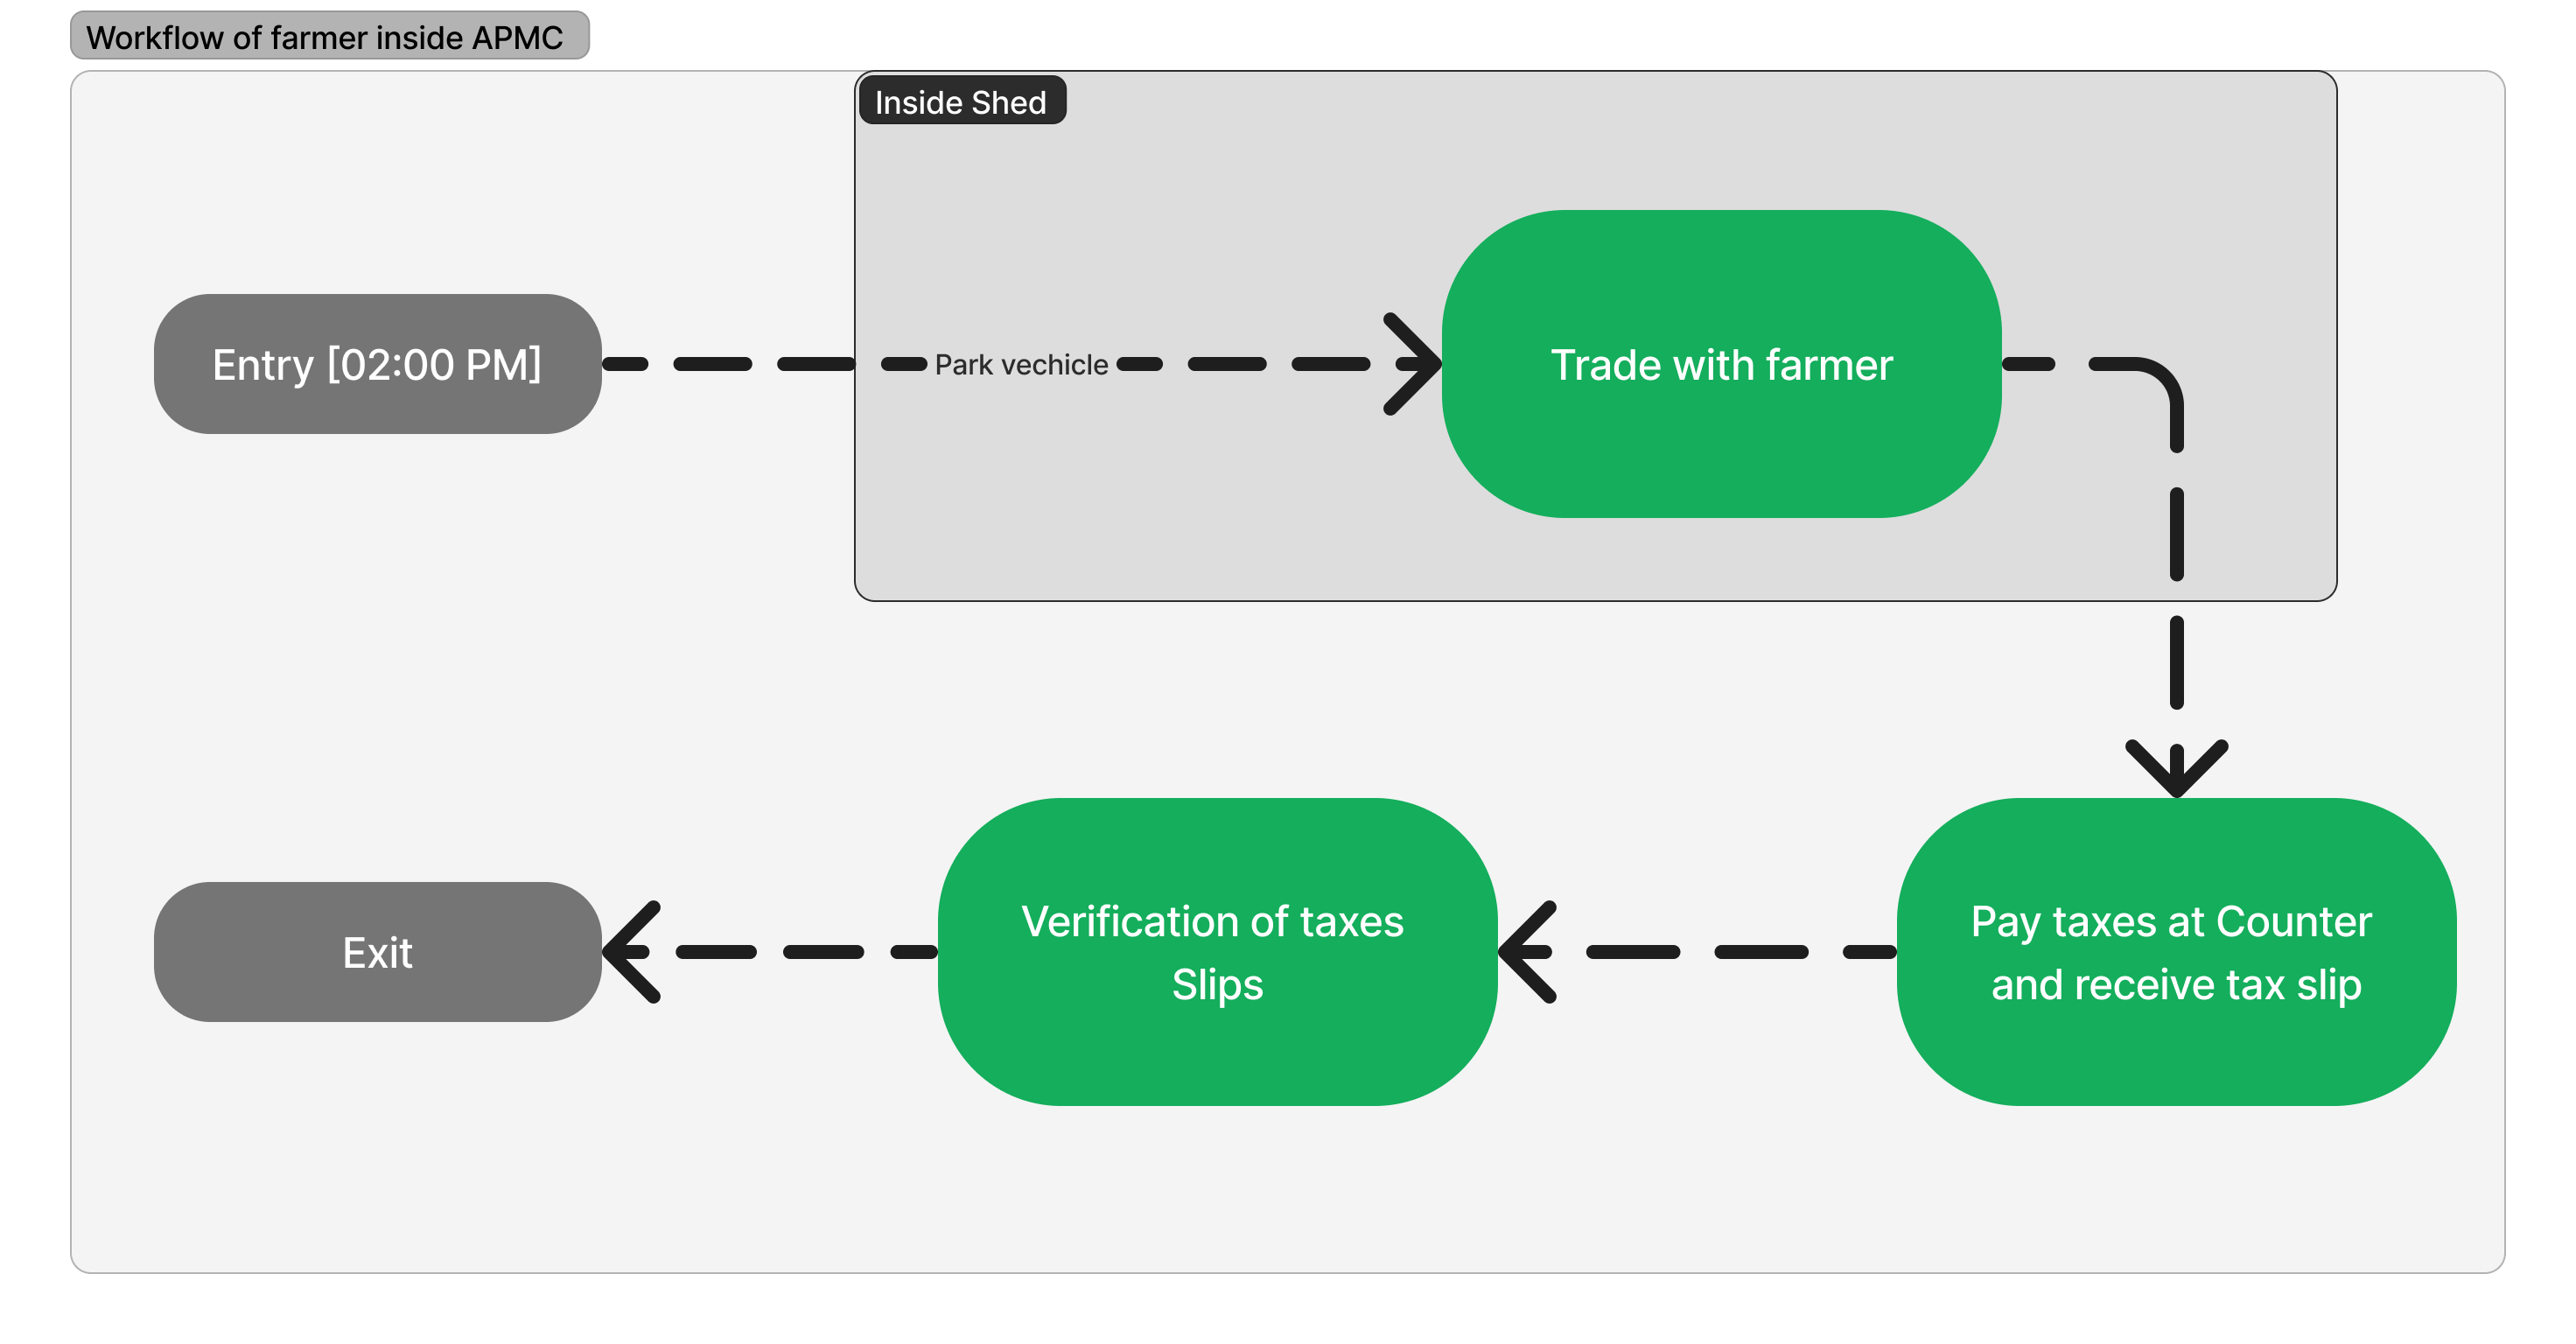
Purchaser Workflow
Problem 1
Tax theft by Wage Worker
Explaination
White Paper

Financial Year 2021-22
Net Quantity Arrived
Vs
Net Quantity Sold
Monthly Basis
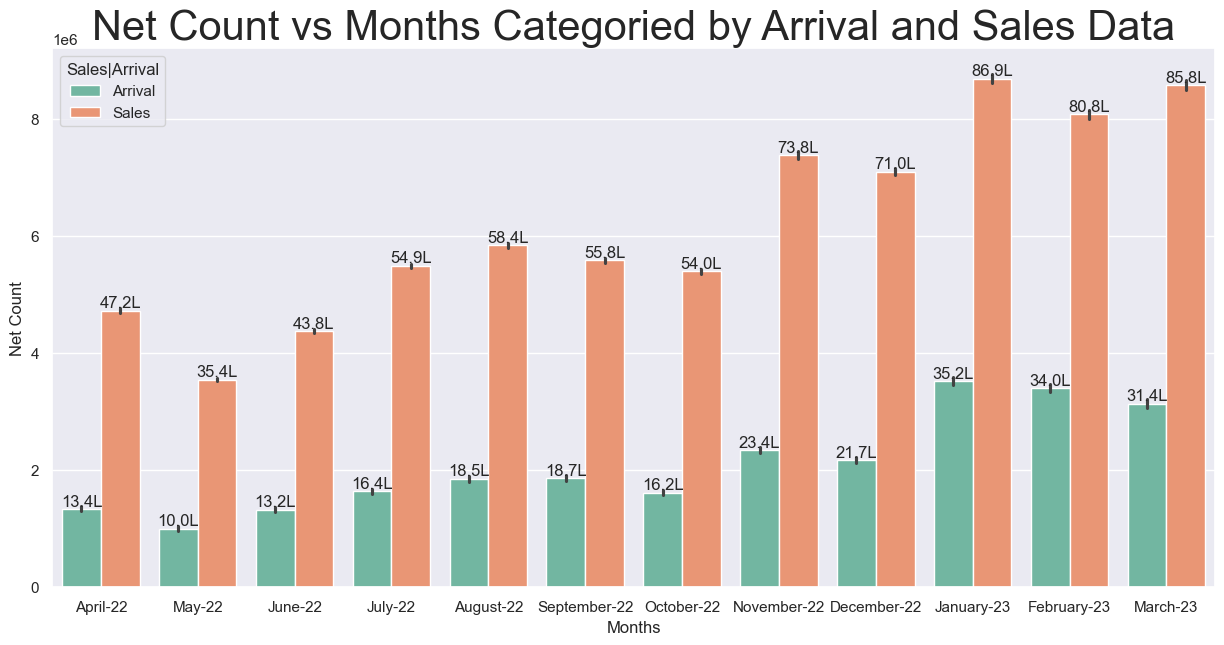
Financial Year 2021-22
Net Tax from
Farmer
Vs
Net Tax from
Purchase
Monthly Basis
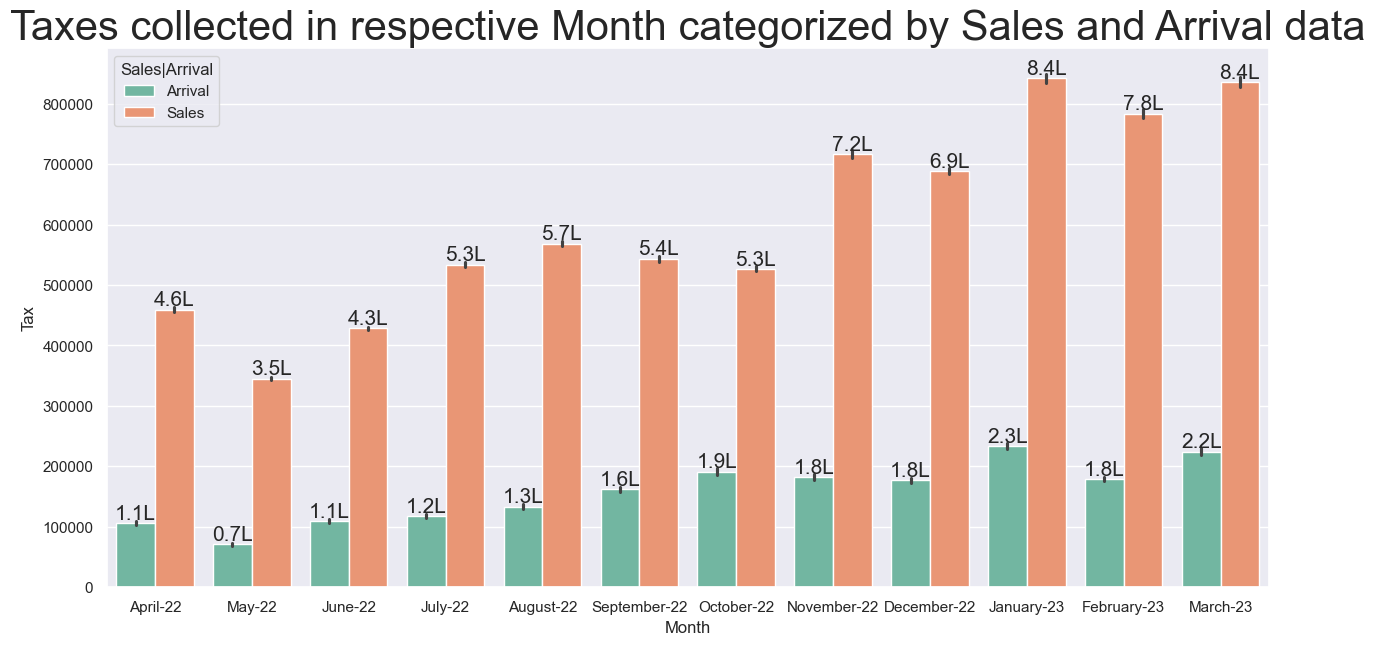
Financial Year 2022-23

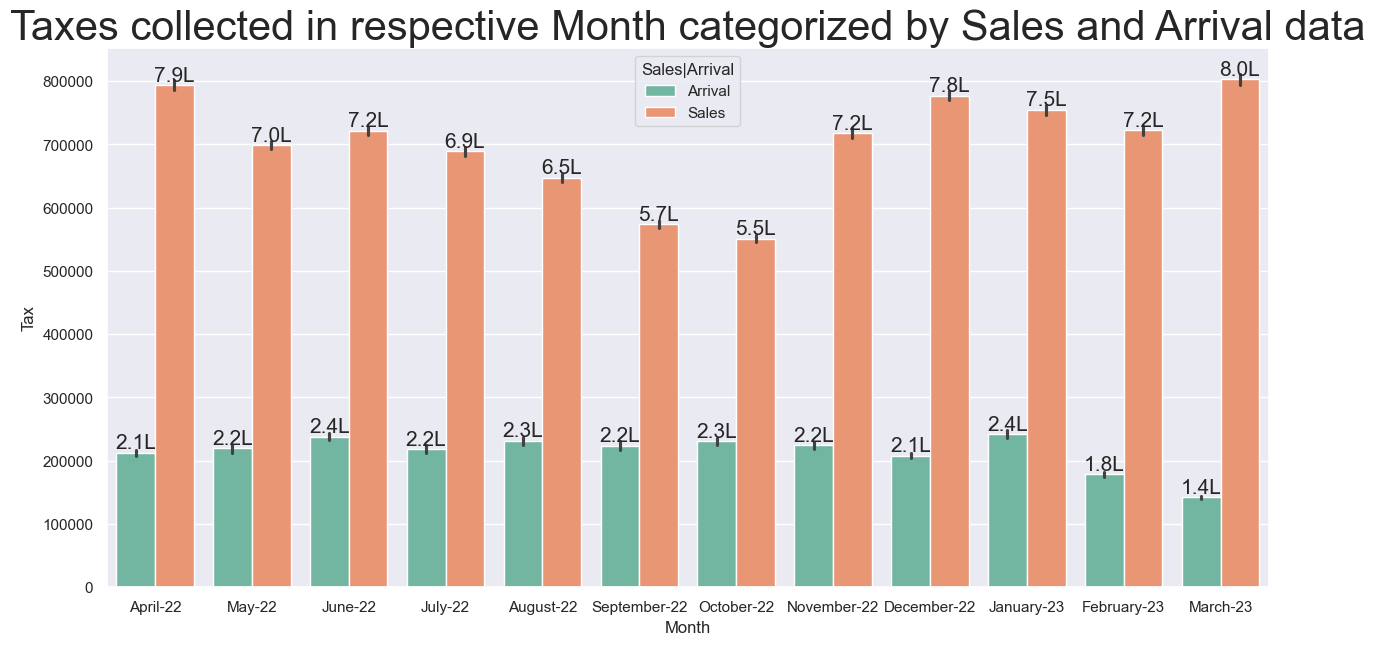
Solution
Daily Verification of Quantity
Net Arrival = Net Sales
1. Take note of Net Count from each excel file from TVM machine daily
2. Divide above values into Arrival and Sales
3. Sum them to get total arrival and sales of phalebhaji
4. They should match
5. If arrival > Sales, then it is also acceptable(Why?)--- Later on this
Problem 2
Fixed price of 650 for every Commodity
Explaination
The Price 650 is Questionable and not align with APMC Mission
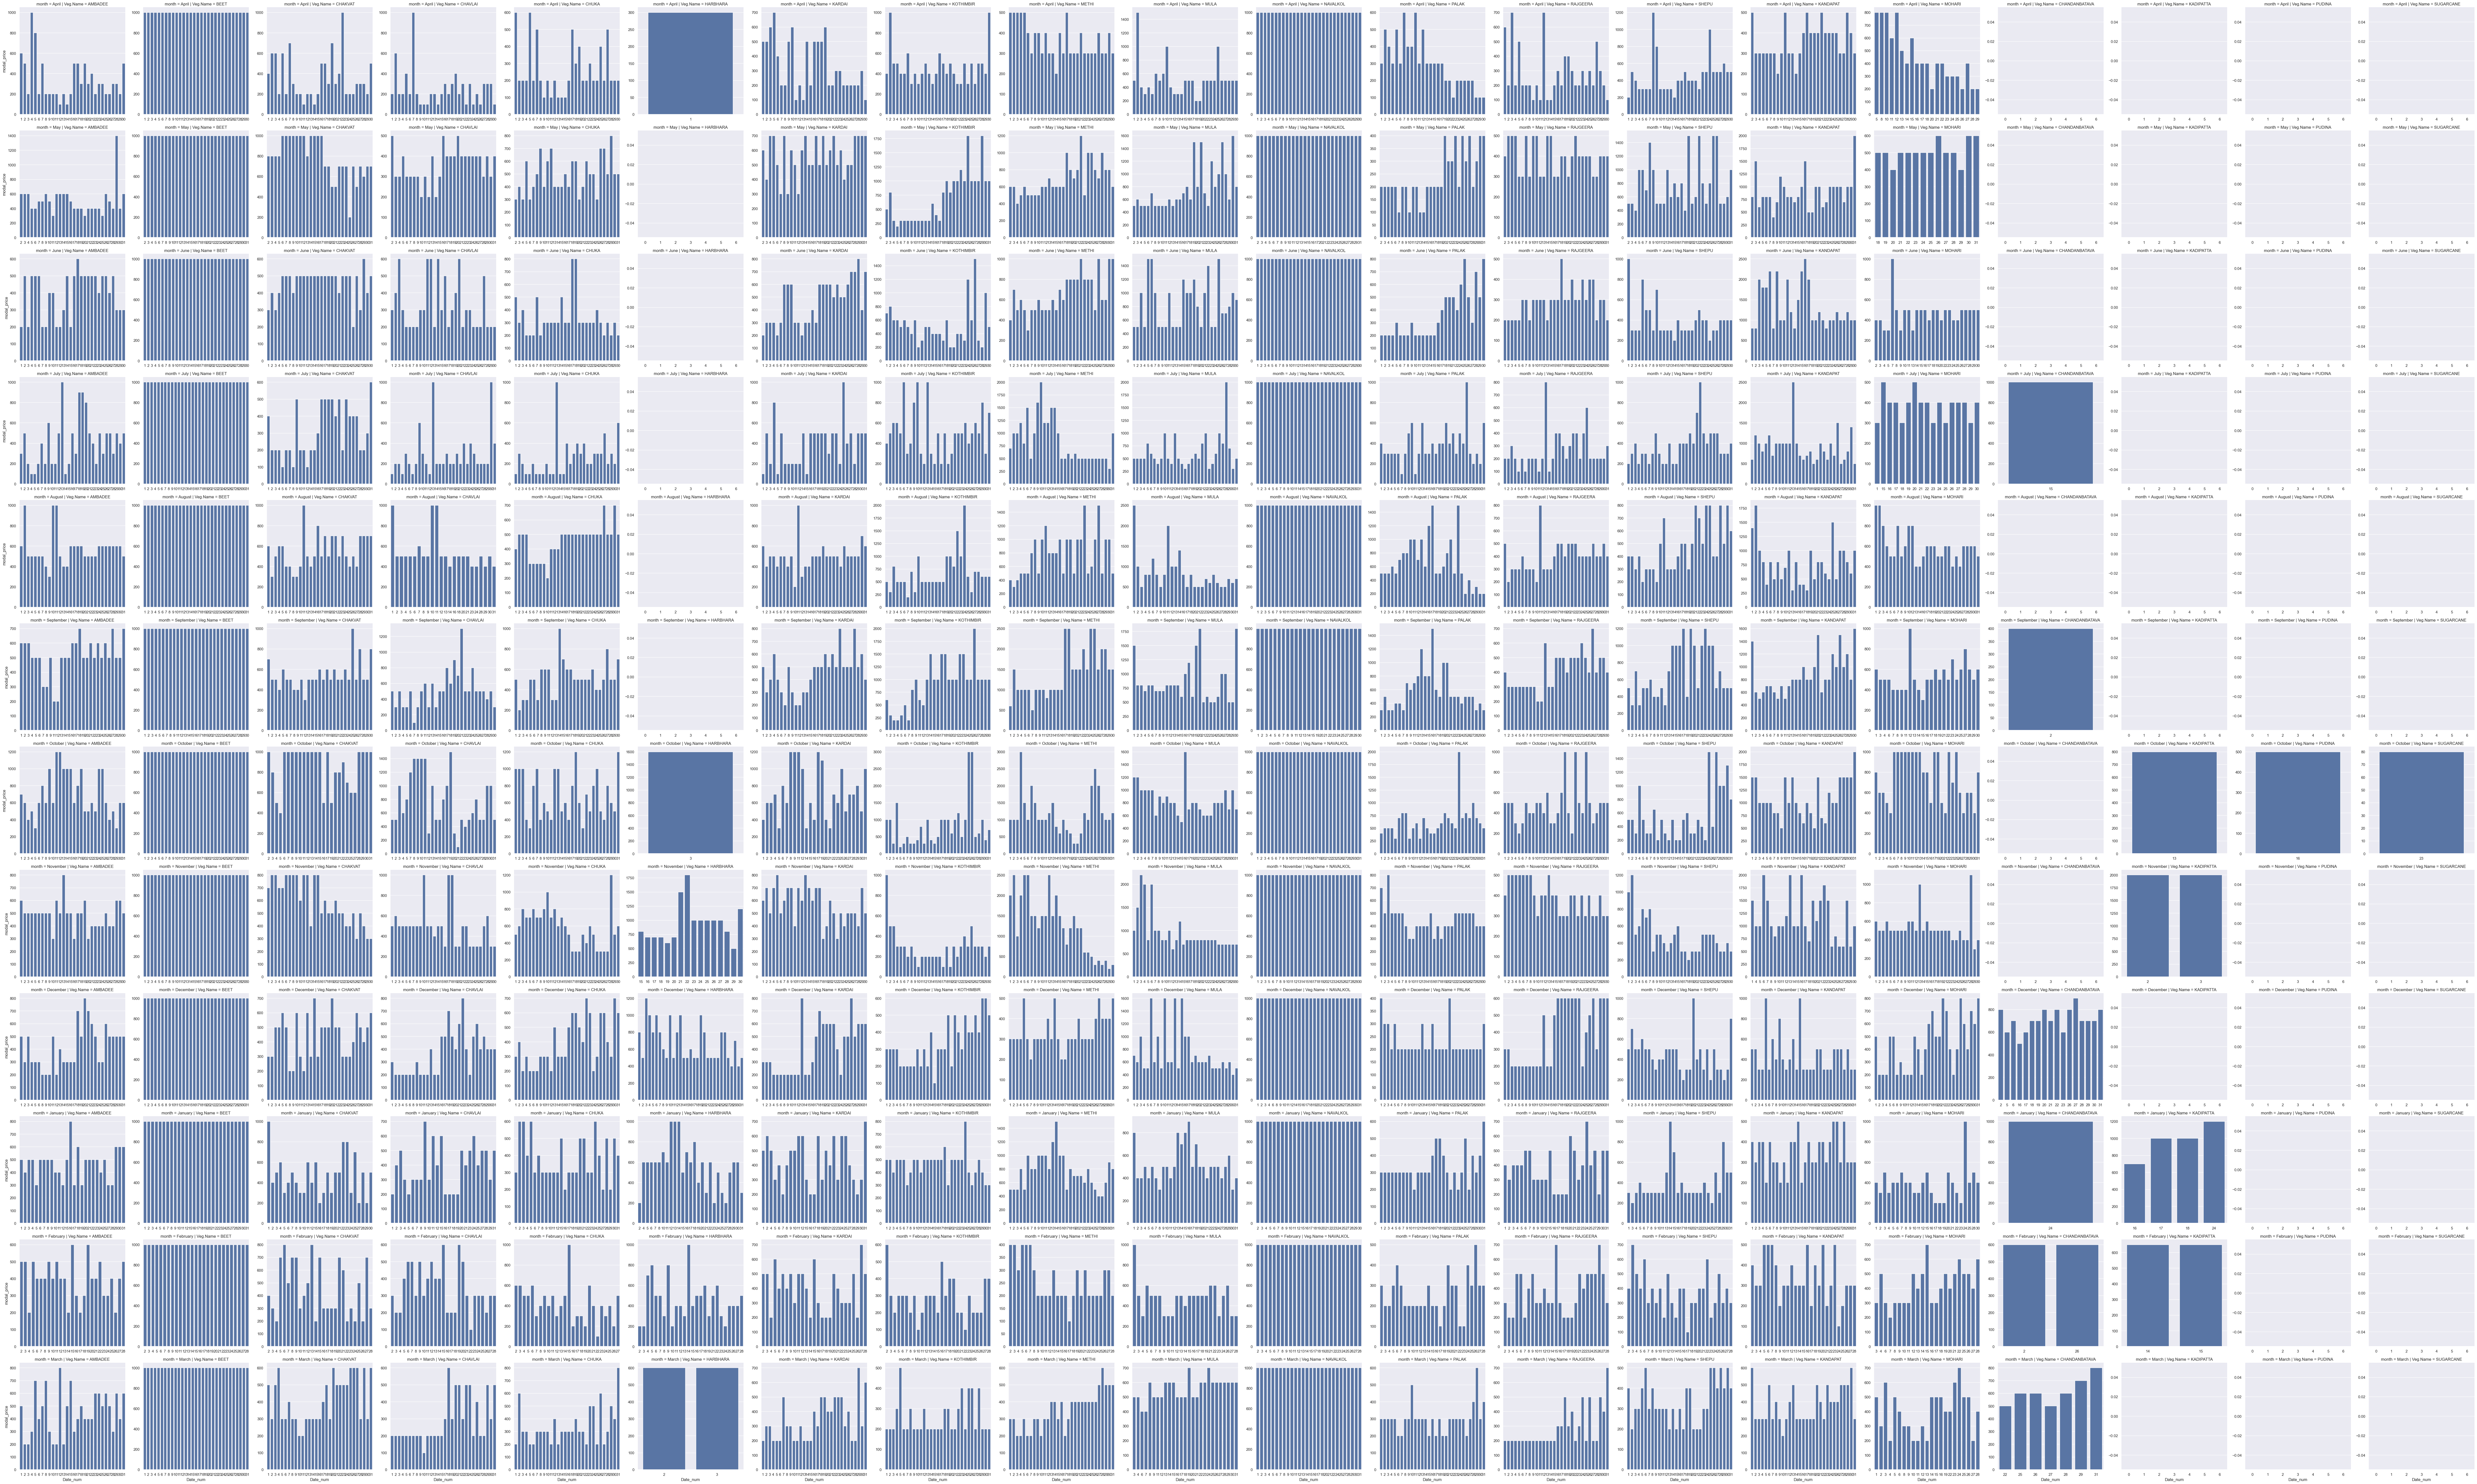
Variation of Prices of different commodities
10/20 phalebhaji maximum sales price variation less the 650
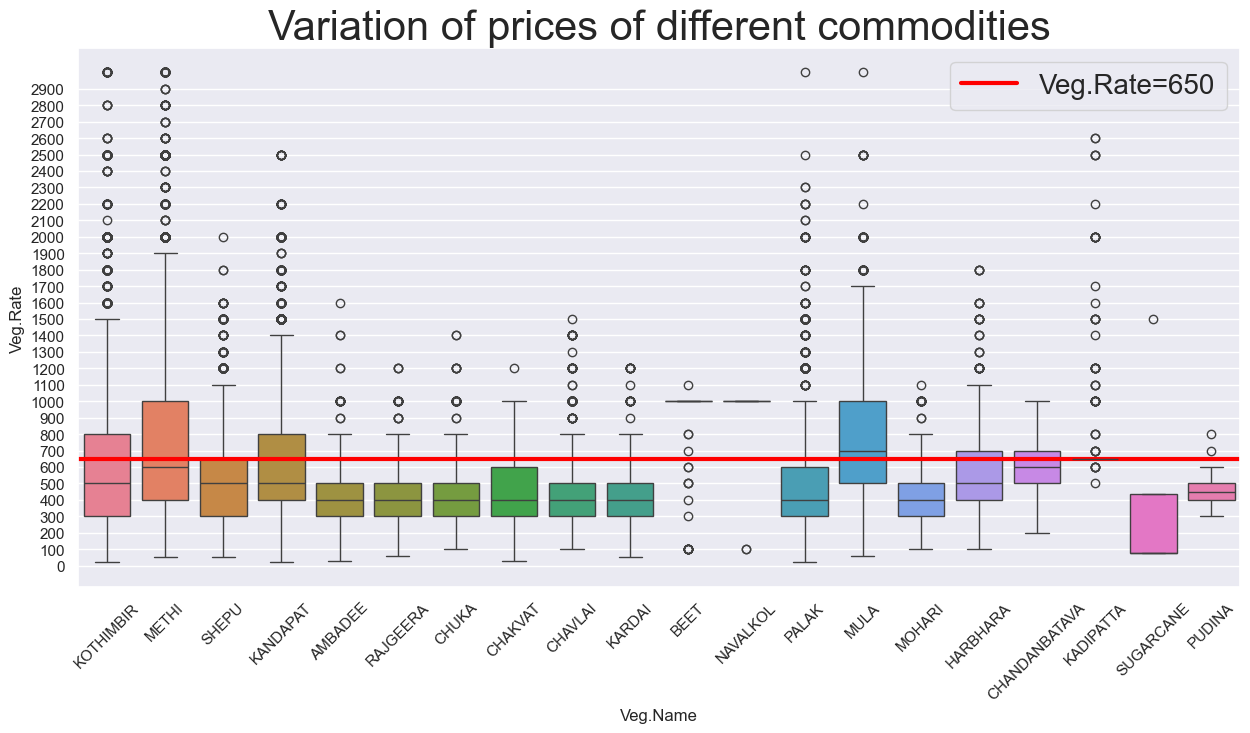
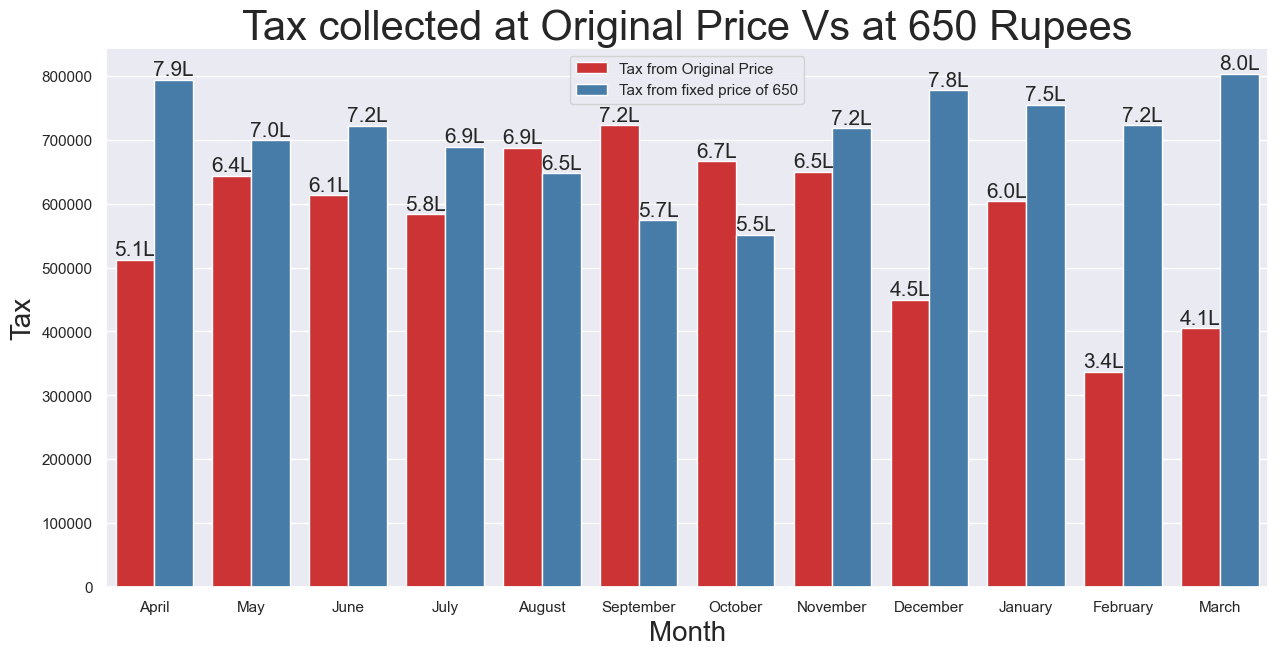
Tax collected at original price Vs at fixed price of Rupees 650
Proportion of Net Count
where
Veg.Rate <= 650 Rupees
out of
total Net Count
for Financial Year 22-23

74.34%
Solution
Modal Price
1. Find the most frequent price of commodity at particular date/week/month
2. Set this price of next day/week/month
3. Big APMC use this modal pricing to get estimation of future day
Problem 3
Tax slip verification and traffic congestion
Explanation
Unorgainsed traffic
No personals to organize the vehicles.
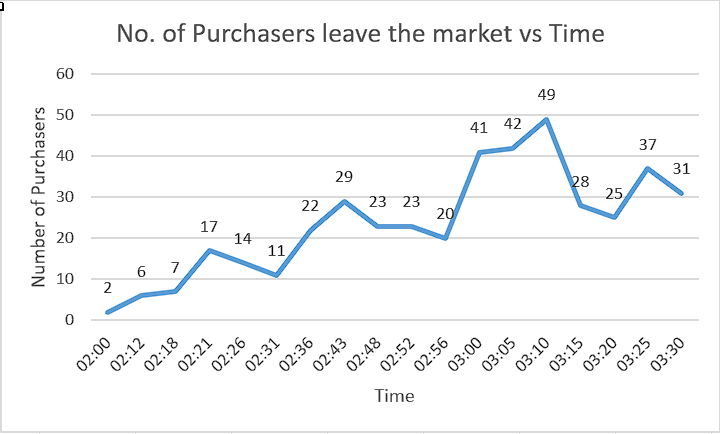
The tax slip issed data does not make sense as they were taken out before the peak hour starts
Survey of a Week
To observe pattern
Solutions
1. More workers needs to employed or current workers asked to shift to control the traffic.
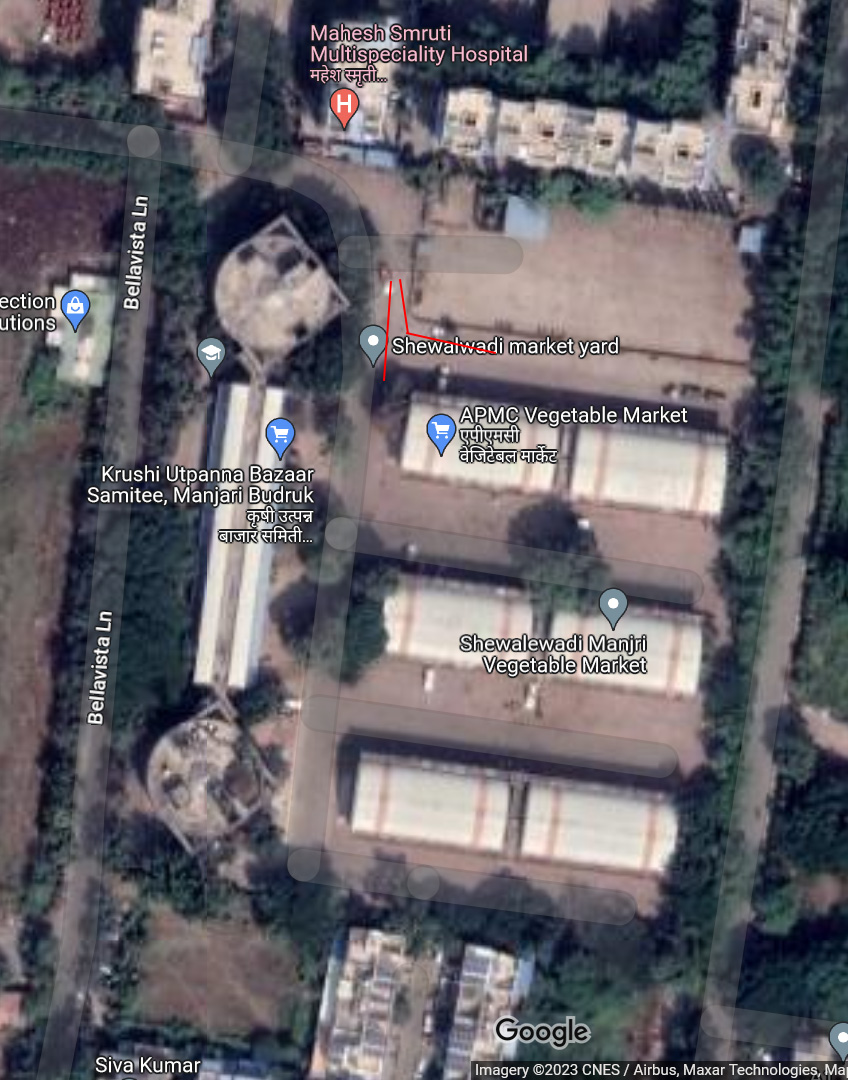
2. Entry and Exit path should be defined and enforced, so traffic can be maintained.
3. 2 Exits(Red) should be made to handle the peak hours around 03:10 PM.
4. The Tax slips verification posts should be placed at red line with more personals instead of two,
so the APMC able to collect more tax by proper checking.
